Community JourneyThe Plot Twisters team's unique community-building process.
Plot Twisters
Personal storytelling as play.
Home
Case Studies 

 Poetic JusticeDigital Interface LabJourney Building PreprintRole Model ReportsThink Tank Book Club
PrototypeAboutPlot Twister WorksheetsVisual and verbal exercises for reflecting on life on paper.
The Homework Plot Twister
The Long Foldable Plot Twister
The Quick Foldable Plot Twister
Cookie Trail Calculator
Gift Tagger
Learning Is About YouFictional short stories about the magic of learning.
Enchanted Loom University, Pt. 1
The Gorgeous Motley Bazaar
Bibliography 


All case studies
Plot Twister WorksheetsVisual and verbal exercises for reflecting on life on paper.
The Homework Plot Twister
The Long Foldable Plot Twister
The Quick Foldable Plot Twister
Cookie Trail Calculator
Gift Tagger
Learning Is About YouFictional short stories about the magic of learning.
Enchanted Loom University, Pt. 1
The Gorgeous Motley Bazaar
← Back to all case studies
Plot Twisters partnered with an EdTech startup (unnamed for the purposes of this case study) in December 2020–January 2021 to develop a fresh take on a multiple-choice assessment dashboard. Designed by Jenny Liu Zhang, Cat Chang, Amanda Curtis, and Melissa Regalado in collaboration with Alex Duffy and Sophie Calloway, this dashboard explores use cases for middle school students and teachers.
Furthermore, this project planted the seed for Plot Twisters' current stance toward the future of learning engagements: Consensual Education [case study release pending].
Introduction
In late 2020, Plot Twisters was introduced to an upcoming EdTech startup developing novel augmented reality (AR) quiz-scanning technology to streamline how multiple-choice assessments are graded. Through an in-depth 6-week design thinking process, we developed an interface that represented our mutual interests in digital learning tools: a learning dashboard that visualizes growth through a comprehensive feedback cycle, prioritizing understanding one's progress over outcomes. Plot Twisters created user journey maps and user interface (UI) wireframes that can be used by teachers for their classrooms, as well as by students for their own personal knowledge tracking.
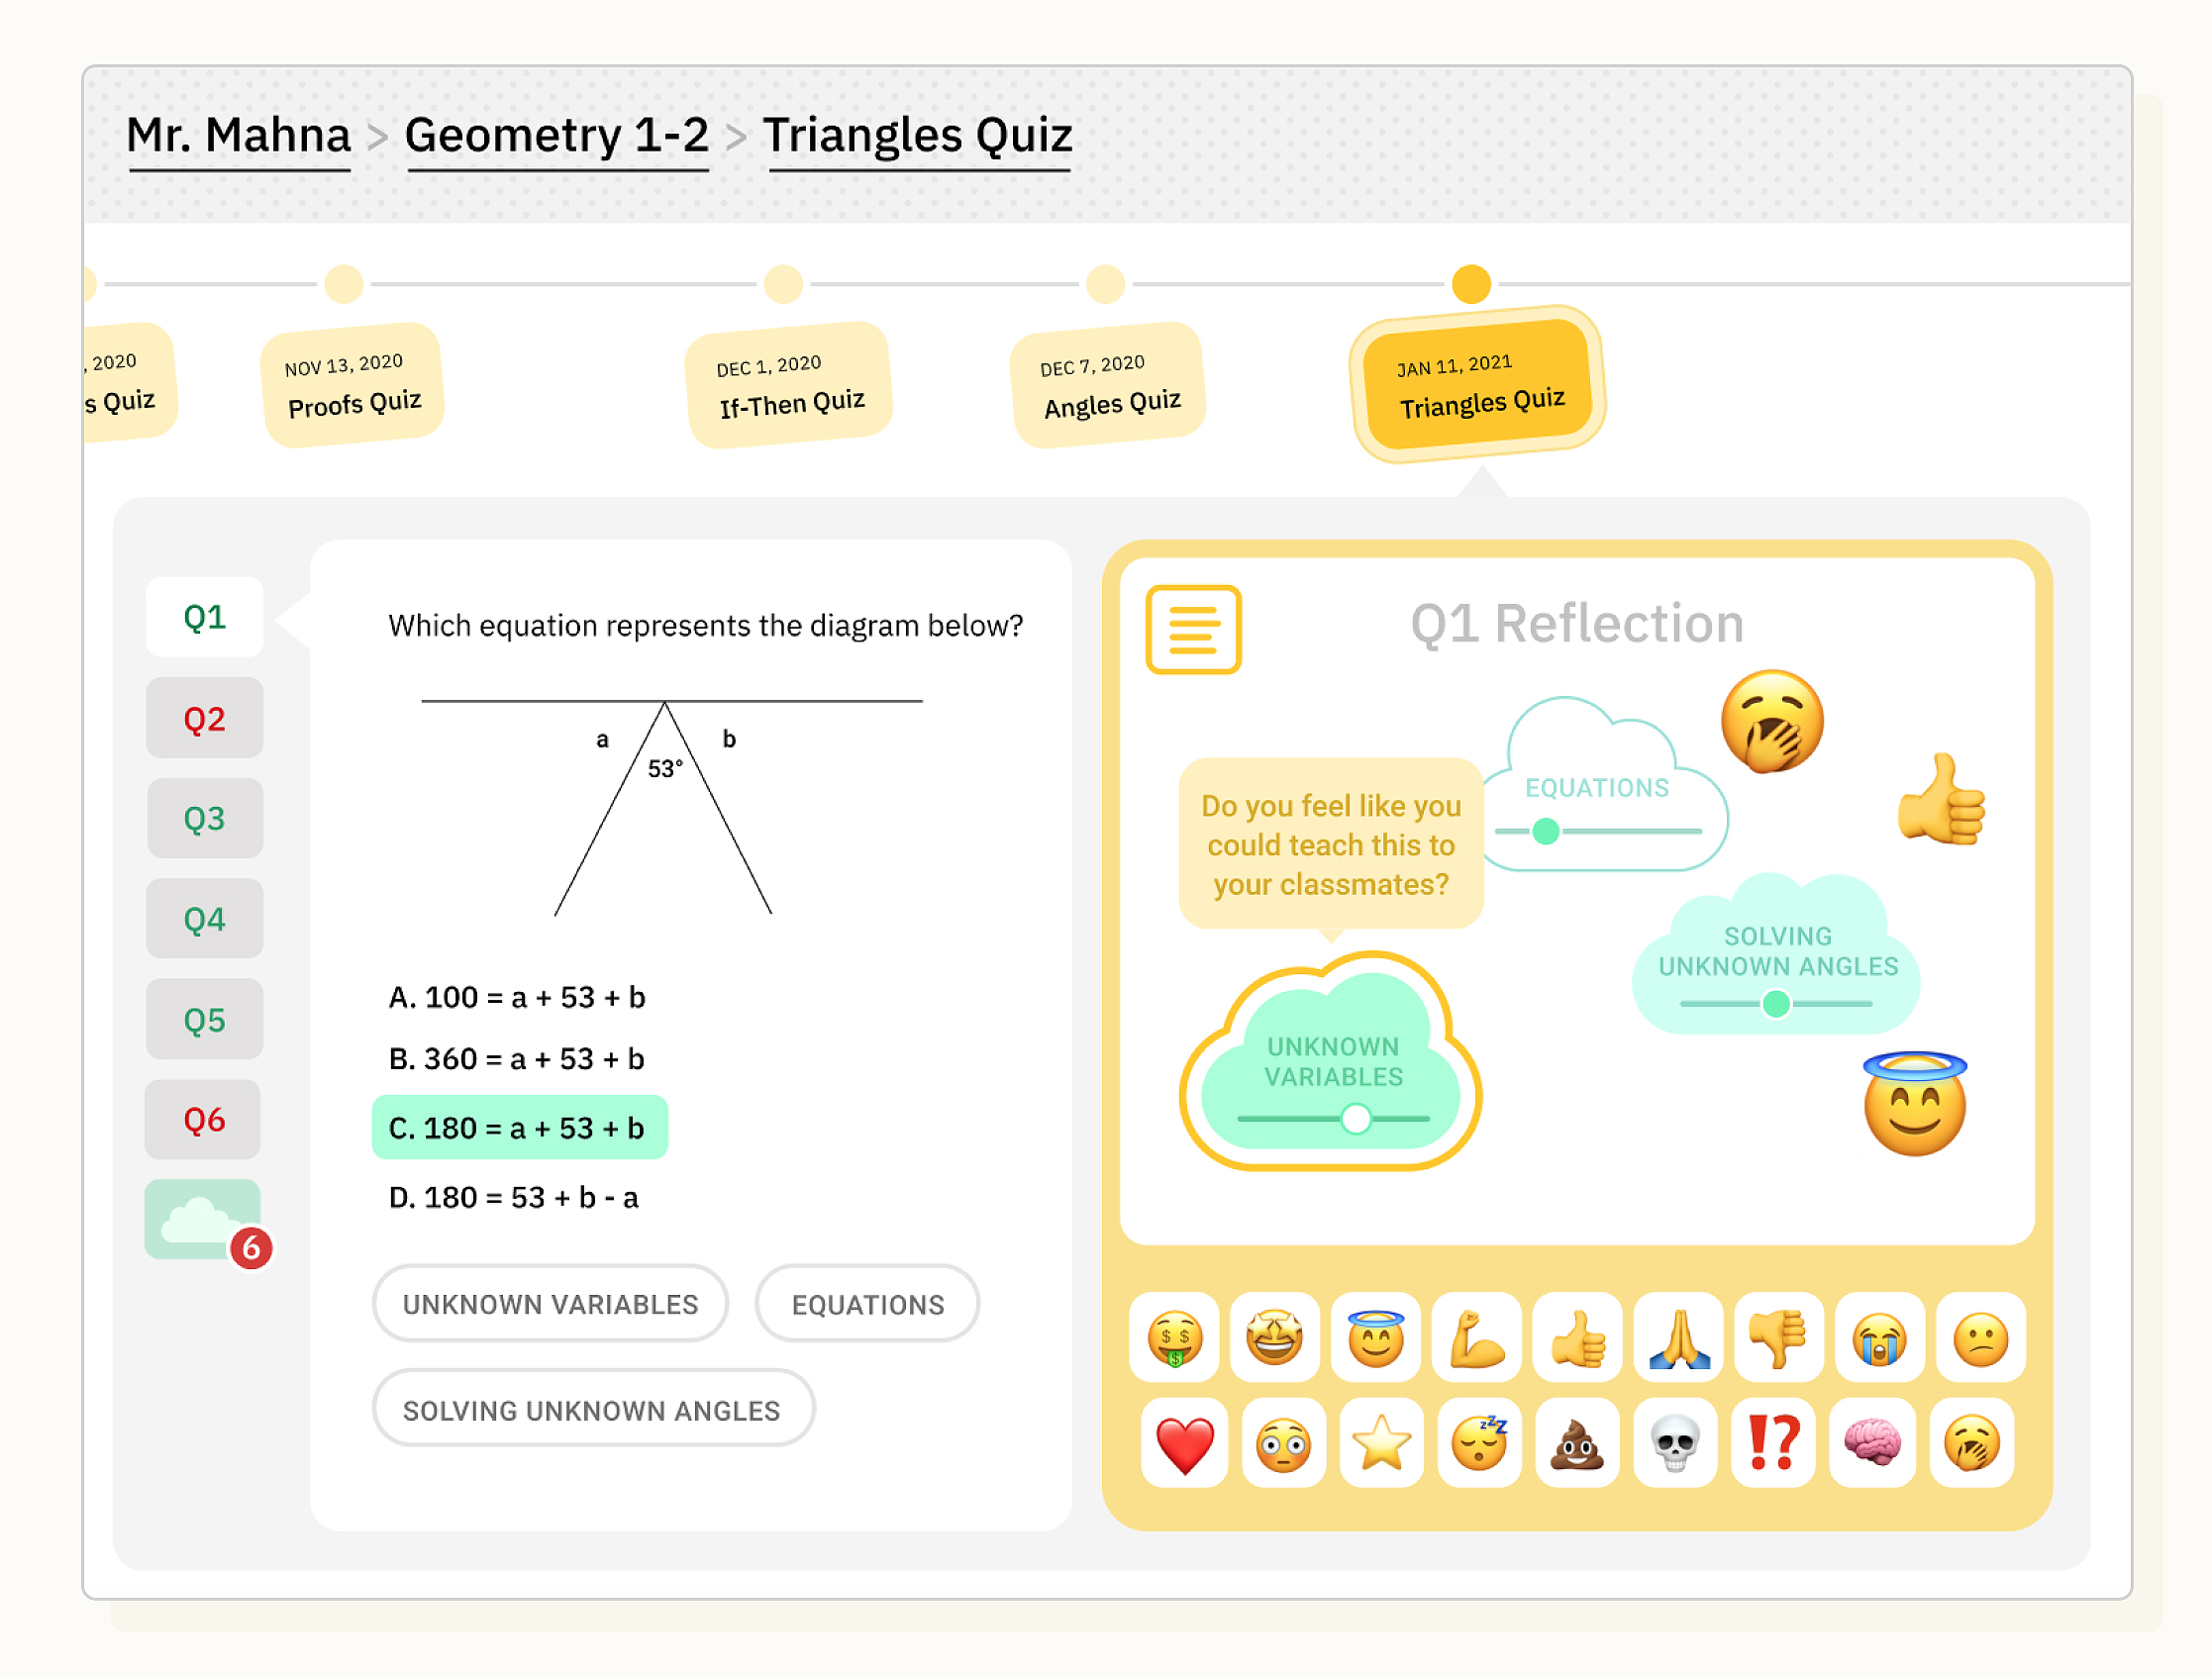 An example screen of the Reflection interface in the dashboard. Learners are equipped to reflect on their emotions, thoughts, and confidence in a topic per question on a quiz. More featured in the Reflections section below.
Discerning visions for the future of education
Our initial meetings were highly conceptual and centered around the future of education at large. We each discussed our distinct visions for the future of education: Plot Twisters, through our studies of anti-oppressive education and self-motivated learning, is committed to promoting learner-driven environments, both within and outside of institutional structures. We are passionate about technology being used as open-source tools that serves the complete liberation and exploration of the learner. In this way, Plot Twisters is inclined to create tools that do not center "teachers," "students," "test scores," "success," and "failure" as these concepts exist in the traditional classroom model. Rather, we seek to develop interfaces that empower learners to create their own goals, assessment metrics, and evaluation methods for whatever subjects and abilities they want to hone, then to communicate their knowledge to others in a way that is loyal to their learning.
The EdTech startup was also interested in this future, especially a student-to-student approach where learners could compare and contrast their progress journeys with each other, supporting them to discover ways to collaborate in their learning. In the short-term, the startup was eager to take a first step toward this vision and proposed a dashboard that encompassed the basic interface elements to make these futures possible, while using their AR technology to scan quiz feedback as a first input. Because these goals were mutually aligned in this early stage, we established a partnership to create a prototype interface to connect both of our education-related visions. During our collaborative design sprints, we articulated the following goals and questions for the interface:
Building quizzes for measuring upcoming growth journeys
- Ideal use case (Plot Twisters): All kinds of learners can set their own metrics to track and evaluation methods (beyond multiple choice).
- First use case (EdTech startup): Middle school teachers decide metrics and create multiple choice tests with tags to evaluate their middle school students.
Visualizing growth journeys
- Ideal use case (Plot Twisters): Learners see progress in a growth journey for their self-motivated learning goals.
- First use case (EdTech startup): Students see progress in a growth journey for a subject chosen by their teacher, with specific learning goals chosen through a student-teacher feedback cycle.
- How do we help teachers to advise on learning journeys that are not their own?
- How can tags be used to visualize a growth journey?
- Do teachers help to establish themes/goals with students early on in the year?
- How can students change their goals?
Elucidating themes from growth journeys
- Ideal use case (Plot Twisters): Learners can reflect on and discover themes in their growth journeys, so they can set new goals.
- First use case (EdTech startup): Teachers can discover themes in student growth journeys to better manage their classrooms.
- Are themes decided after taking a quiz or before giving the quiz?
- How can tags be translated into journey themes?
- How can themes gathered from growth journeys be used to help learners find helpful collaborators?
User mapping
We harnessed our team's collective user experience (UX) research experience to create empathy maps and experience maps, focusing on the first use case for the middle school students and teachers. These maps came with both "As-Is" and "To-Be" versions to clearly delineate the benefits of the interface for each of our three goals. These maps informed the creation of some final user journey maps: one for students and one for teachers.
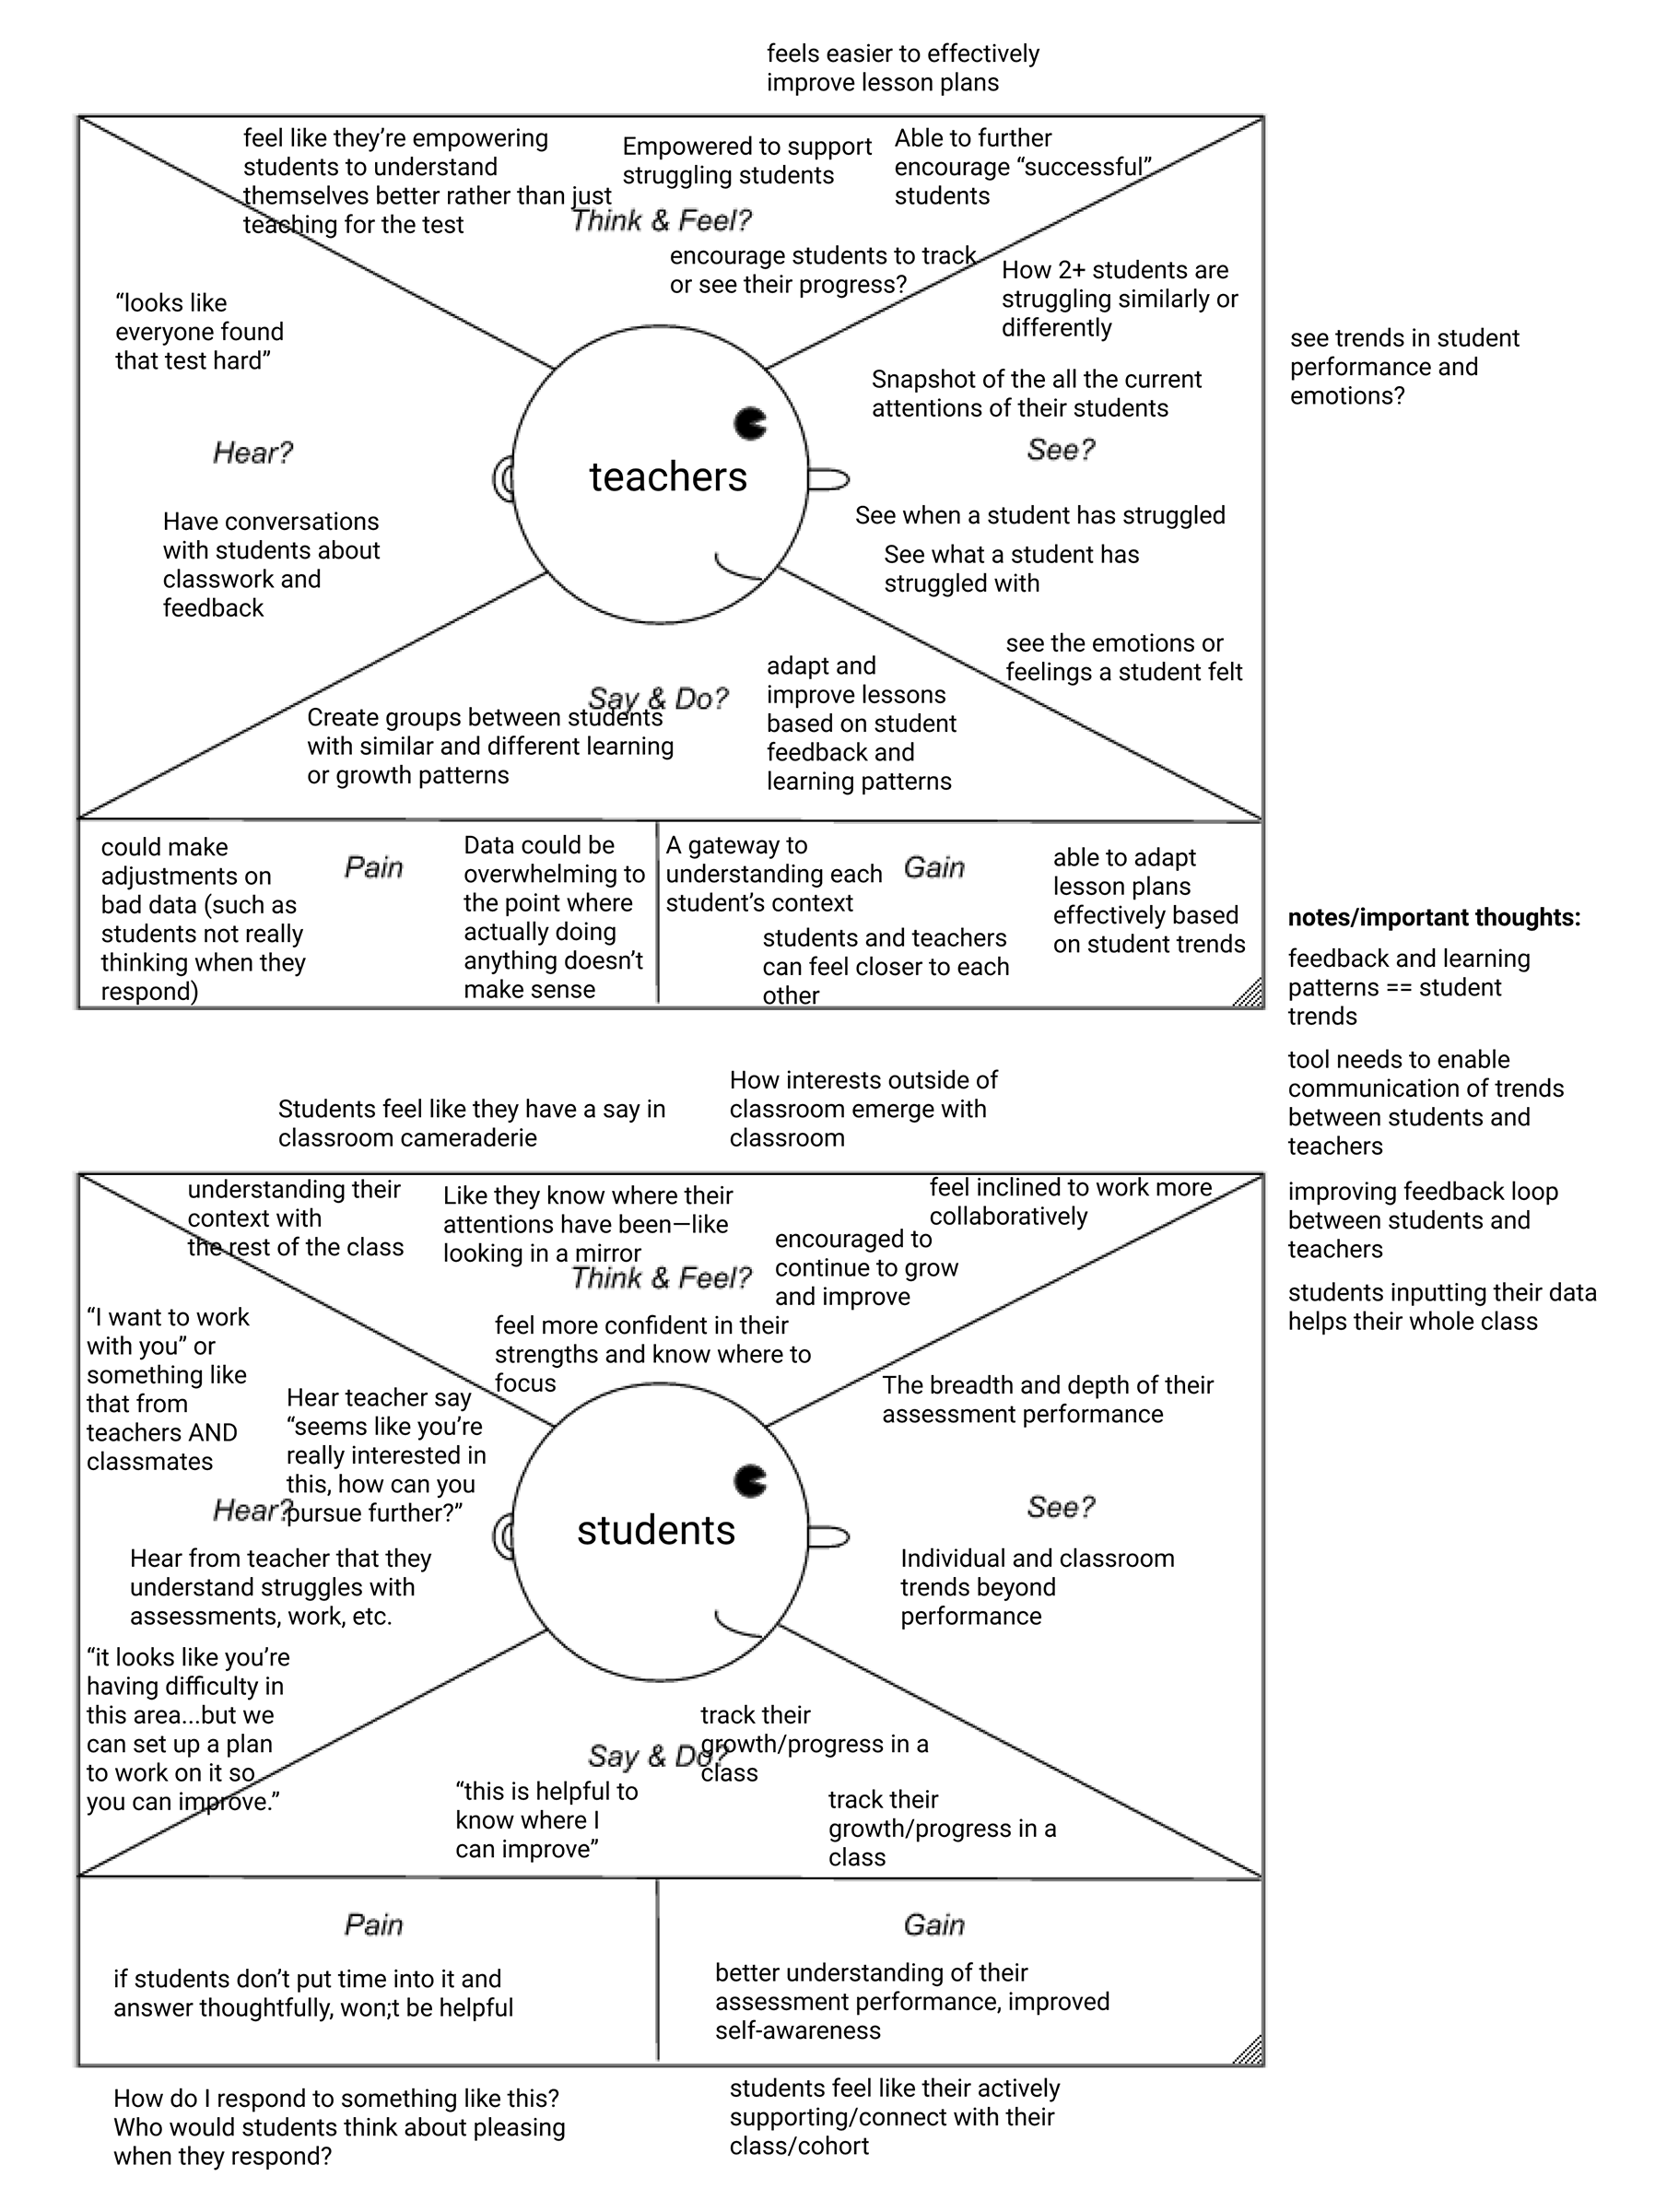 Empathy maps for "As-Is" (without interface) and "To-Be" (with interface) use cases, focusing on interface affordances and user feelings, challenges, and benefits.
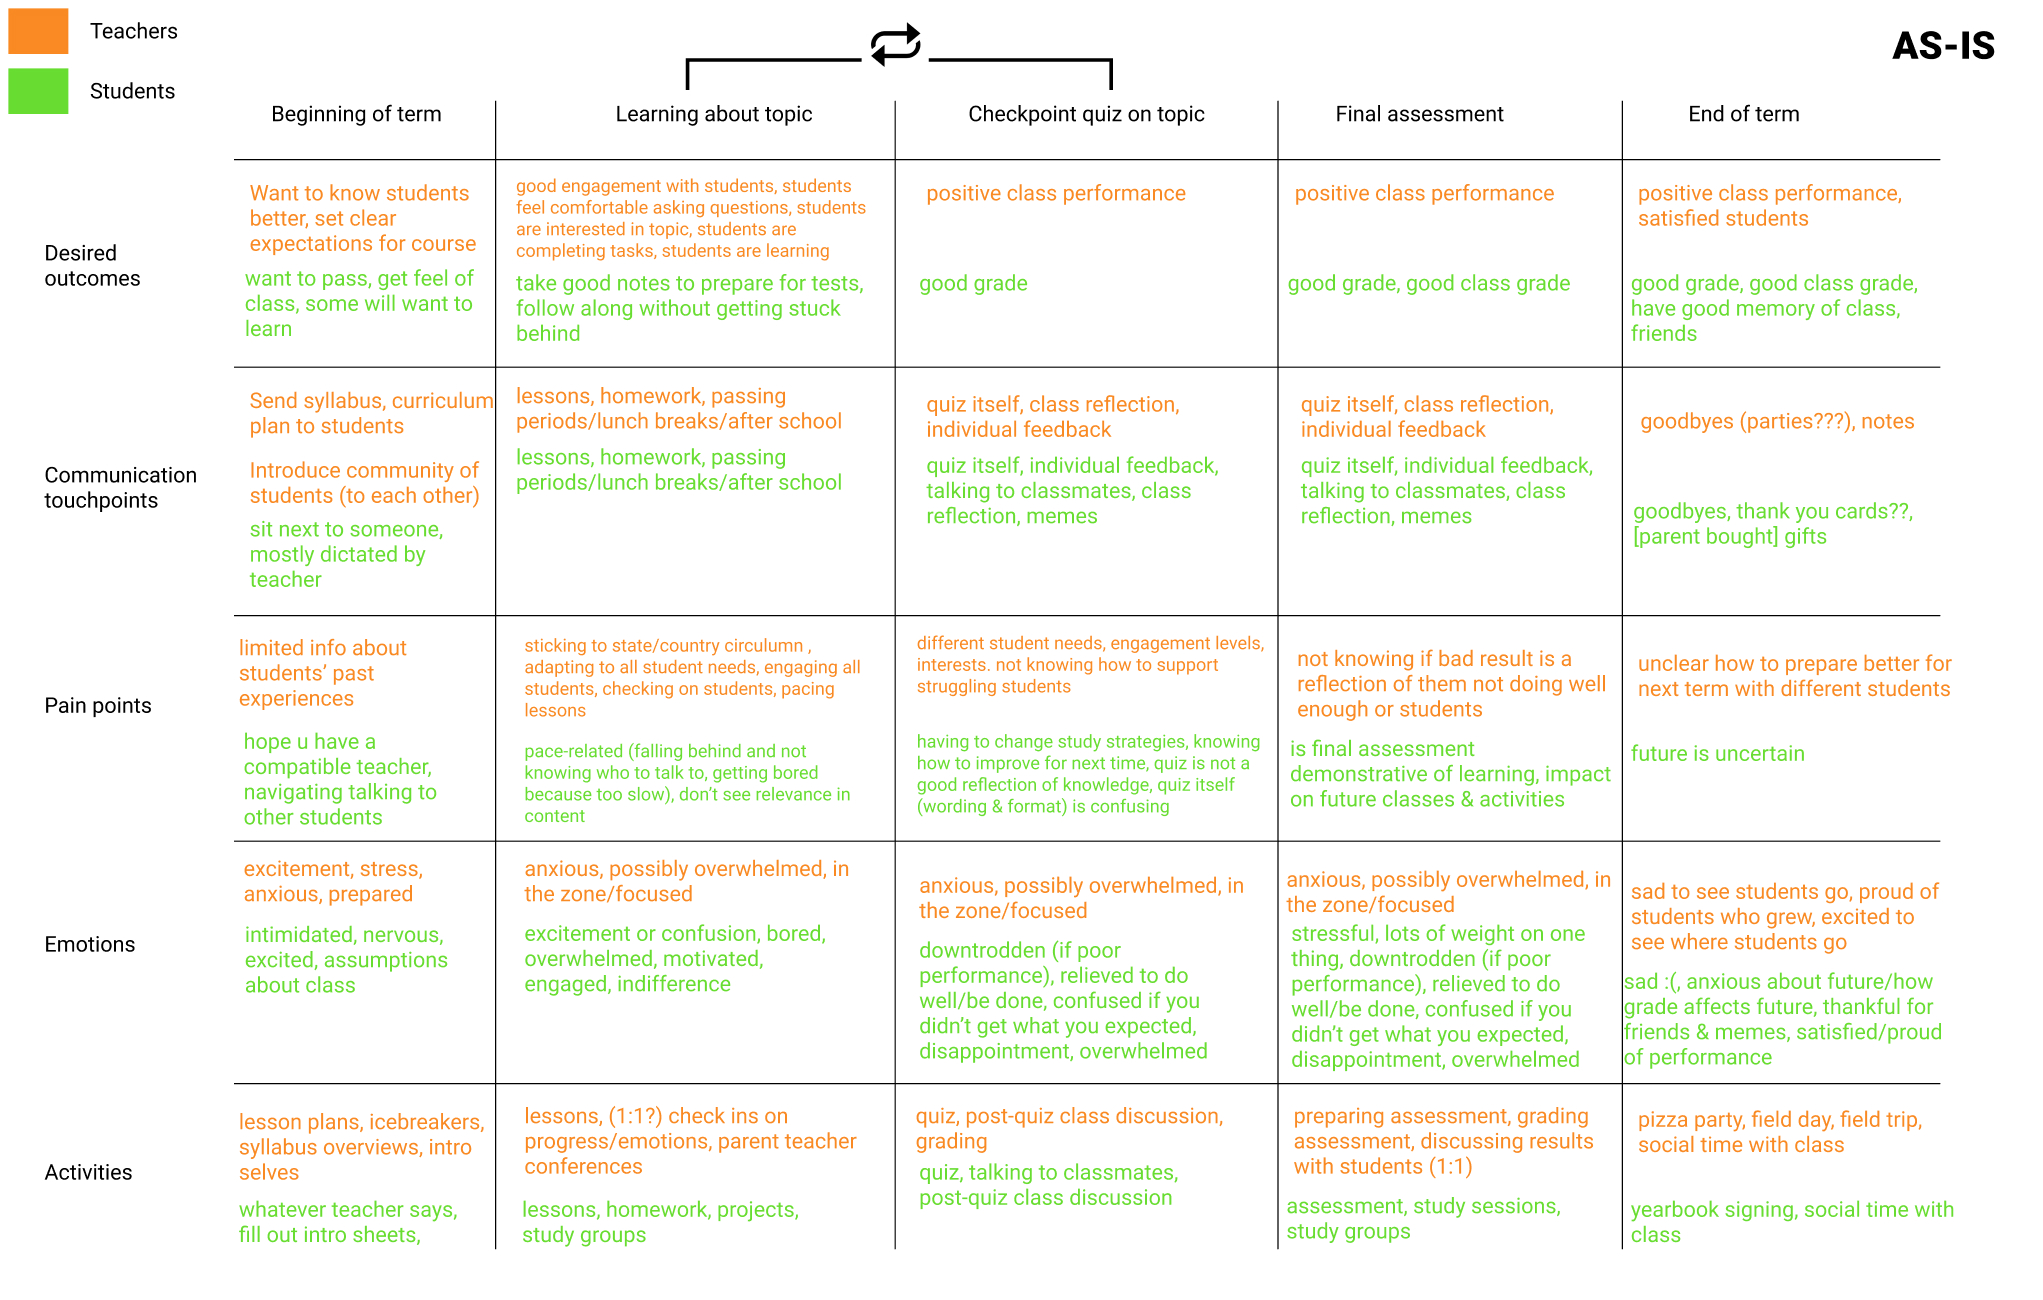 Experience map for "As-Is" (without interface), tracking outcomes, touchpoints, emotions, and behavioral events from the beginning of a term until the end of a term.
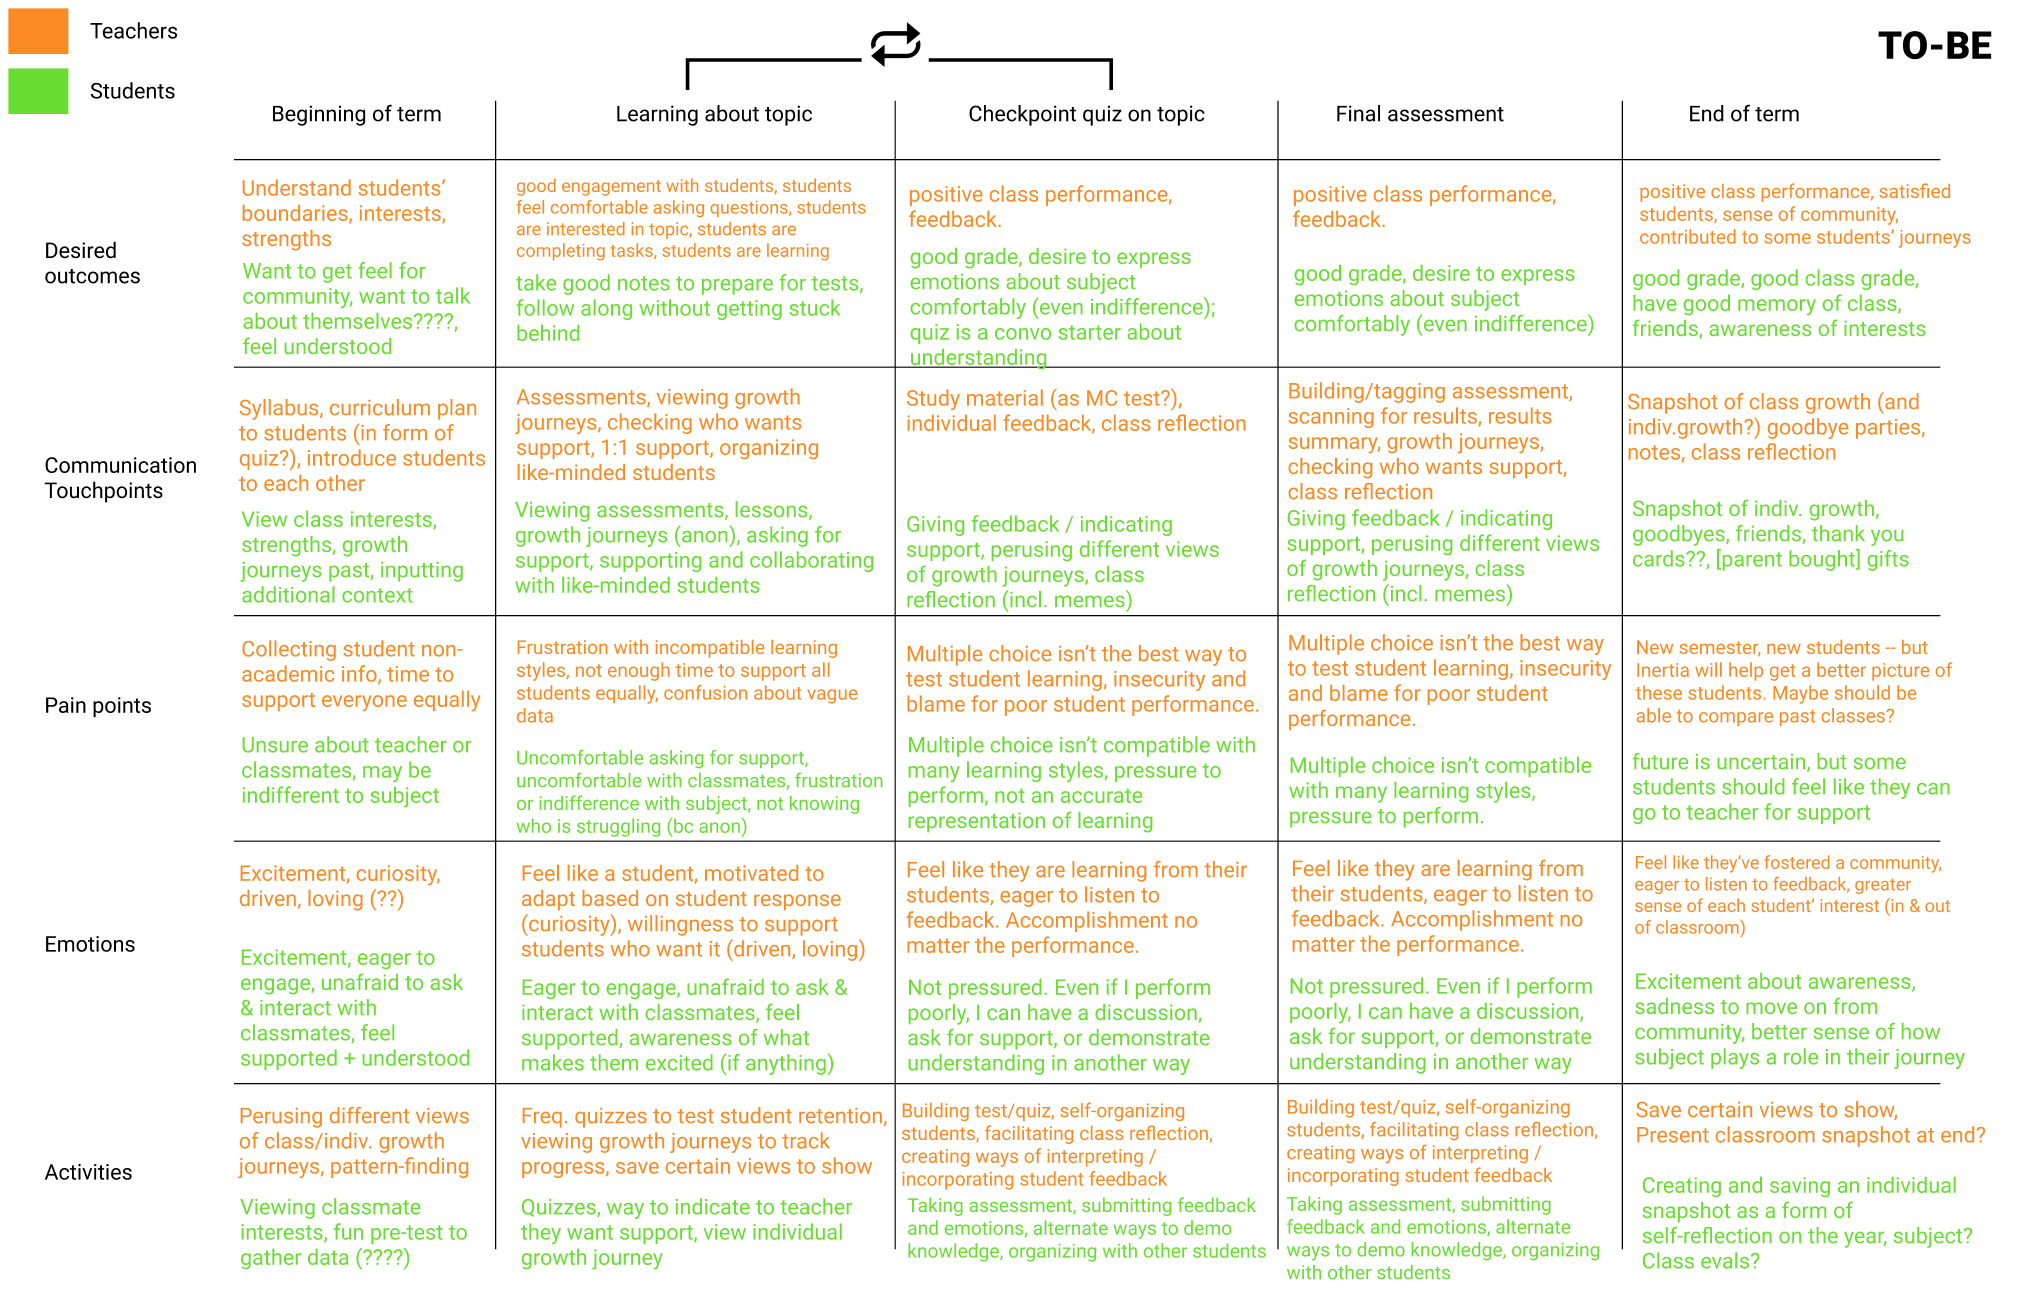 Experience map for "To-Be" (with interface), describing desired outcomes, touchpoints, emotions, and behavioral events during a term.
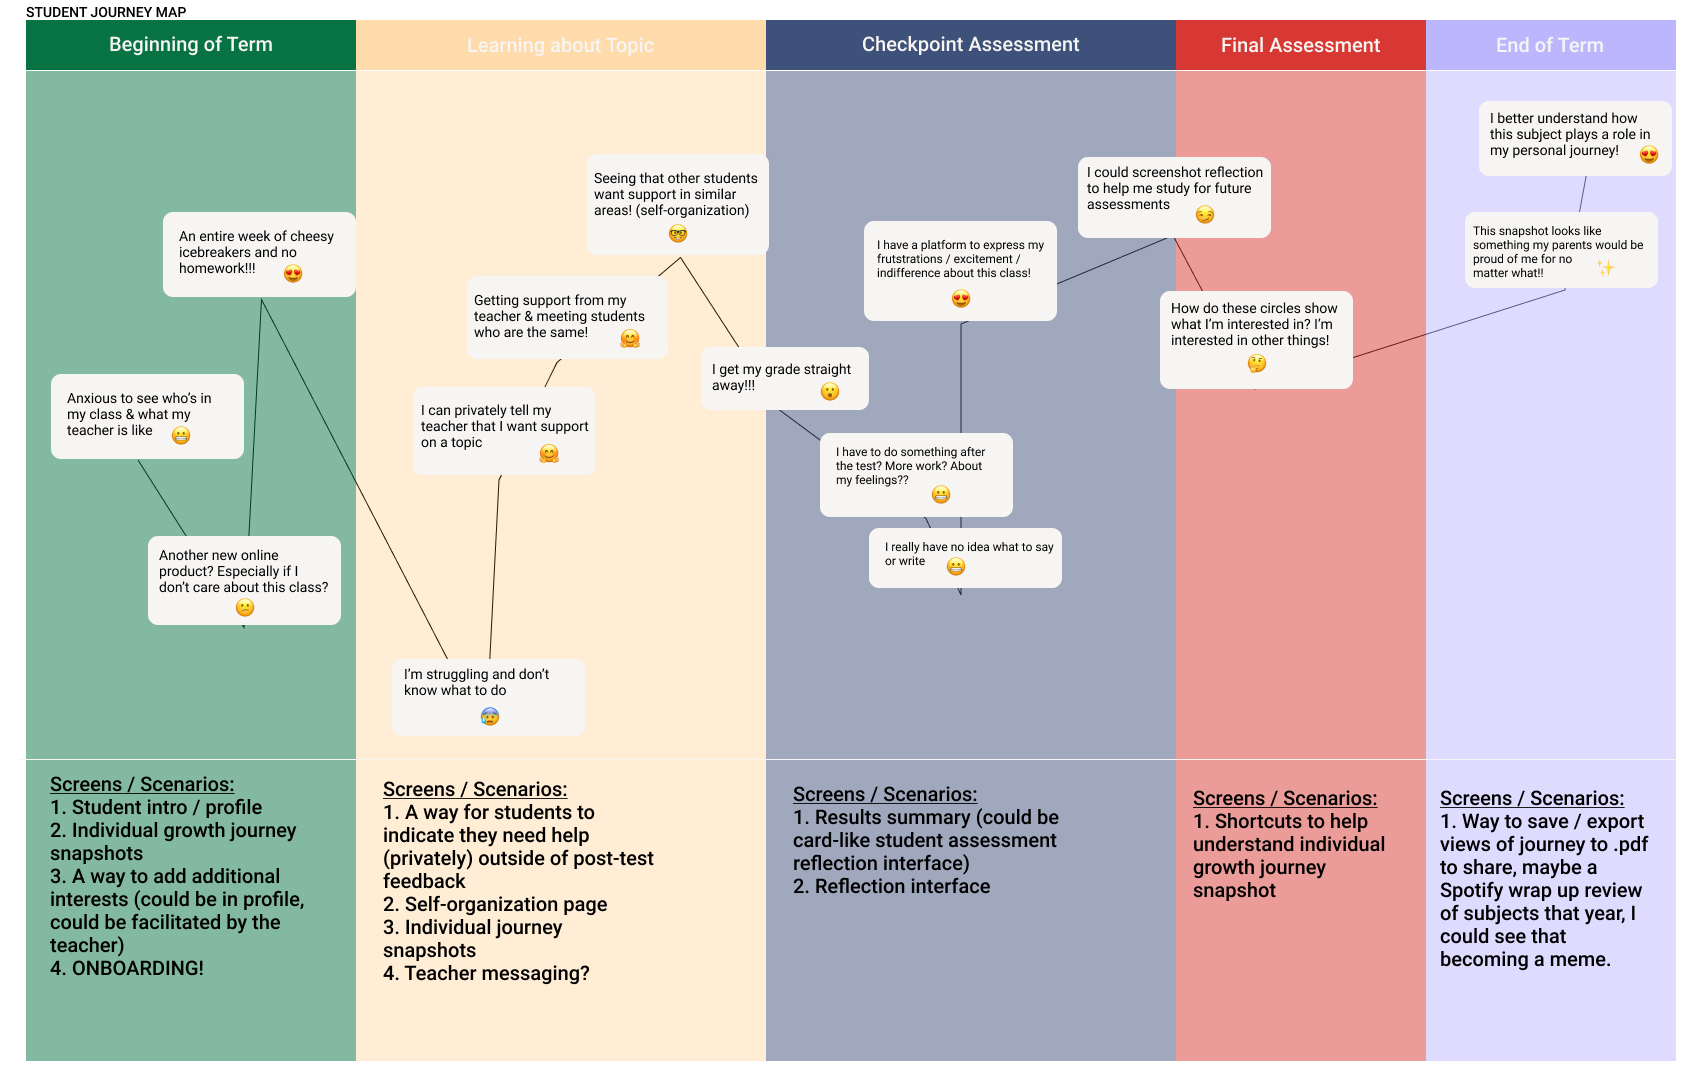 Final user journey map for a student during a term using this dashboard, with interface scenario outlines.
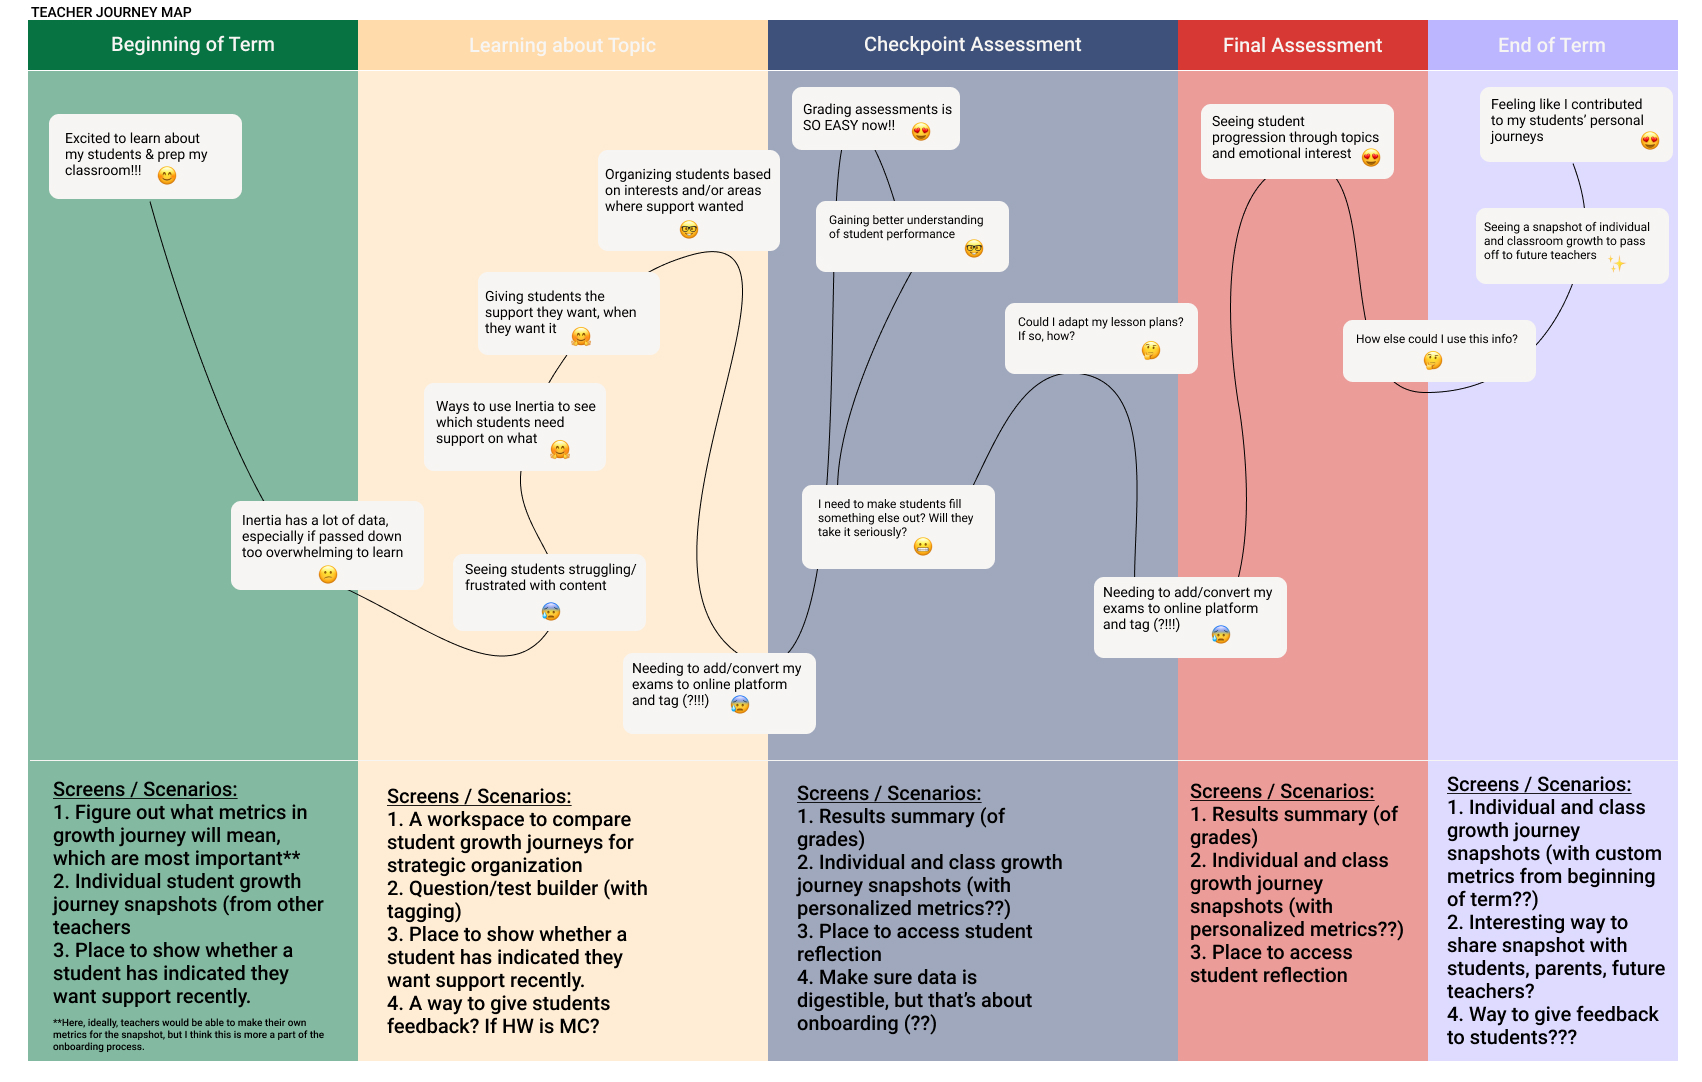 Final user journey map for a teacher using this dashboard.
These research artifacts were used to conceptualize and wireframe screens of what "growth journeys" could look like in this dashboard. We based our interface designs on student user story of taking multiple-choice quizzes and working through quiz feedback throughout a term. By understanding the key milestones, touchpoints, outcomes, pain points, and emotions that teachers and students could feel using this dashboard, we were prepared to ground our visuals in three core interfaces.
Interface 1: Quiz Builder
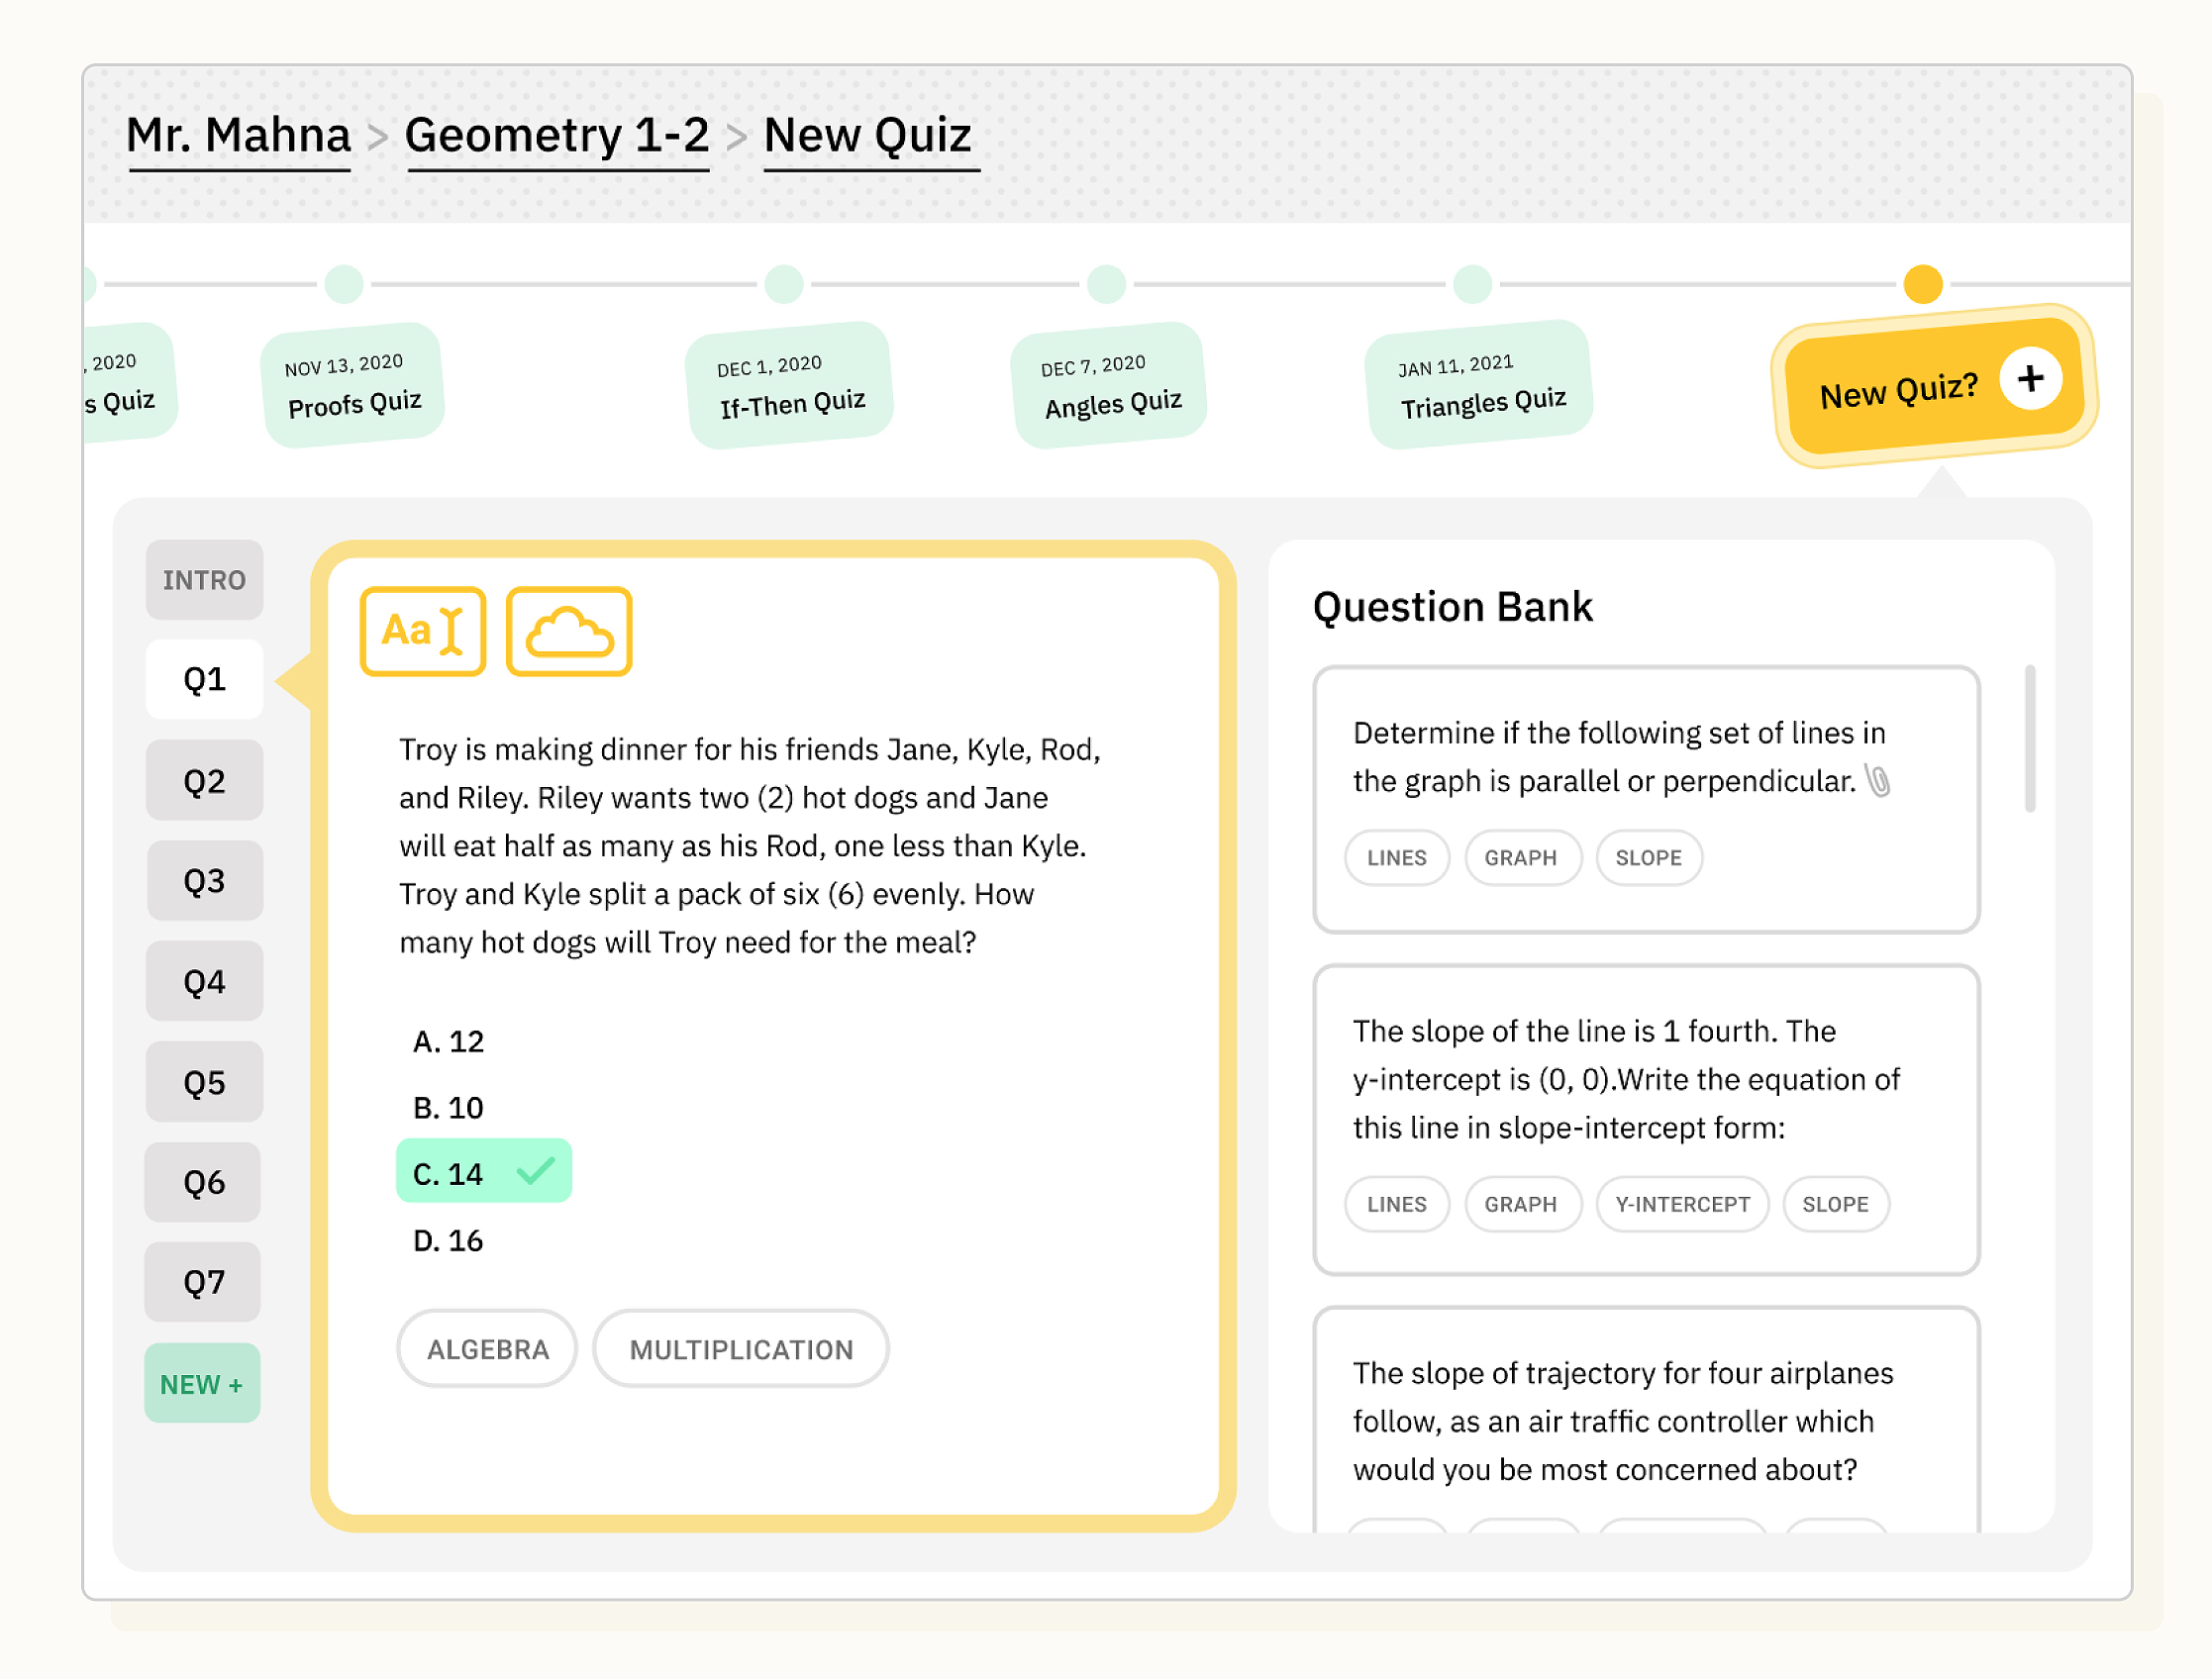
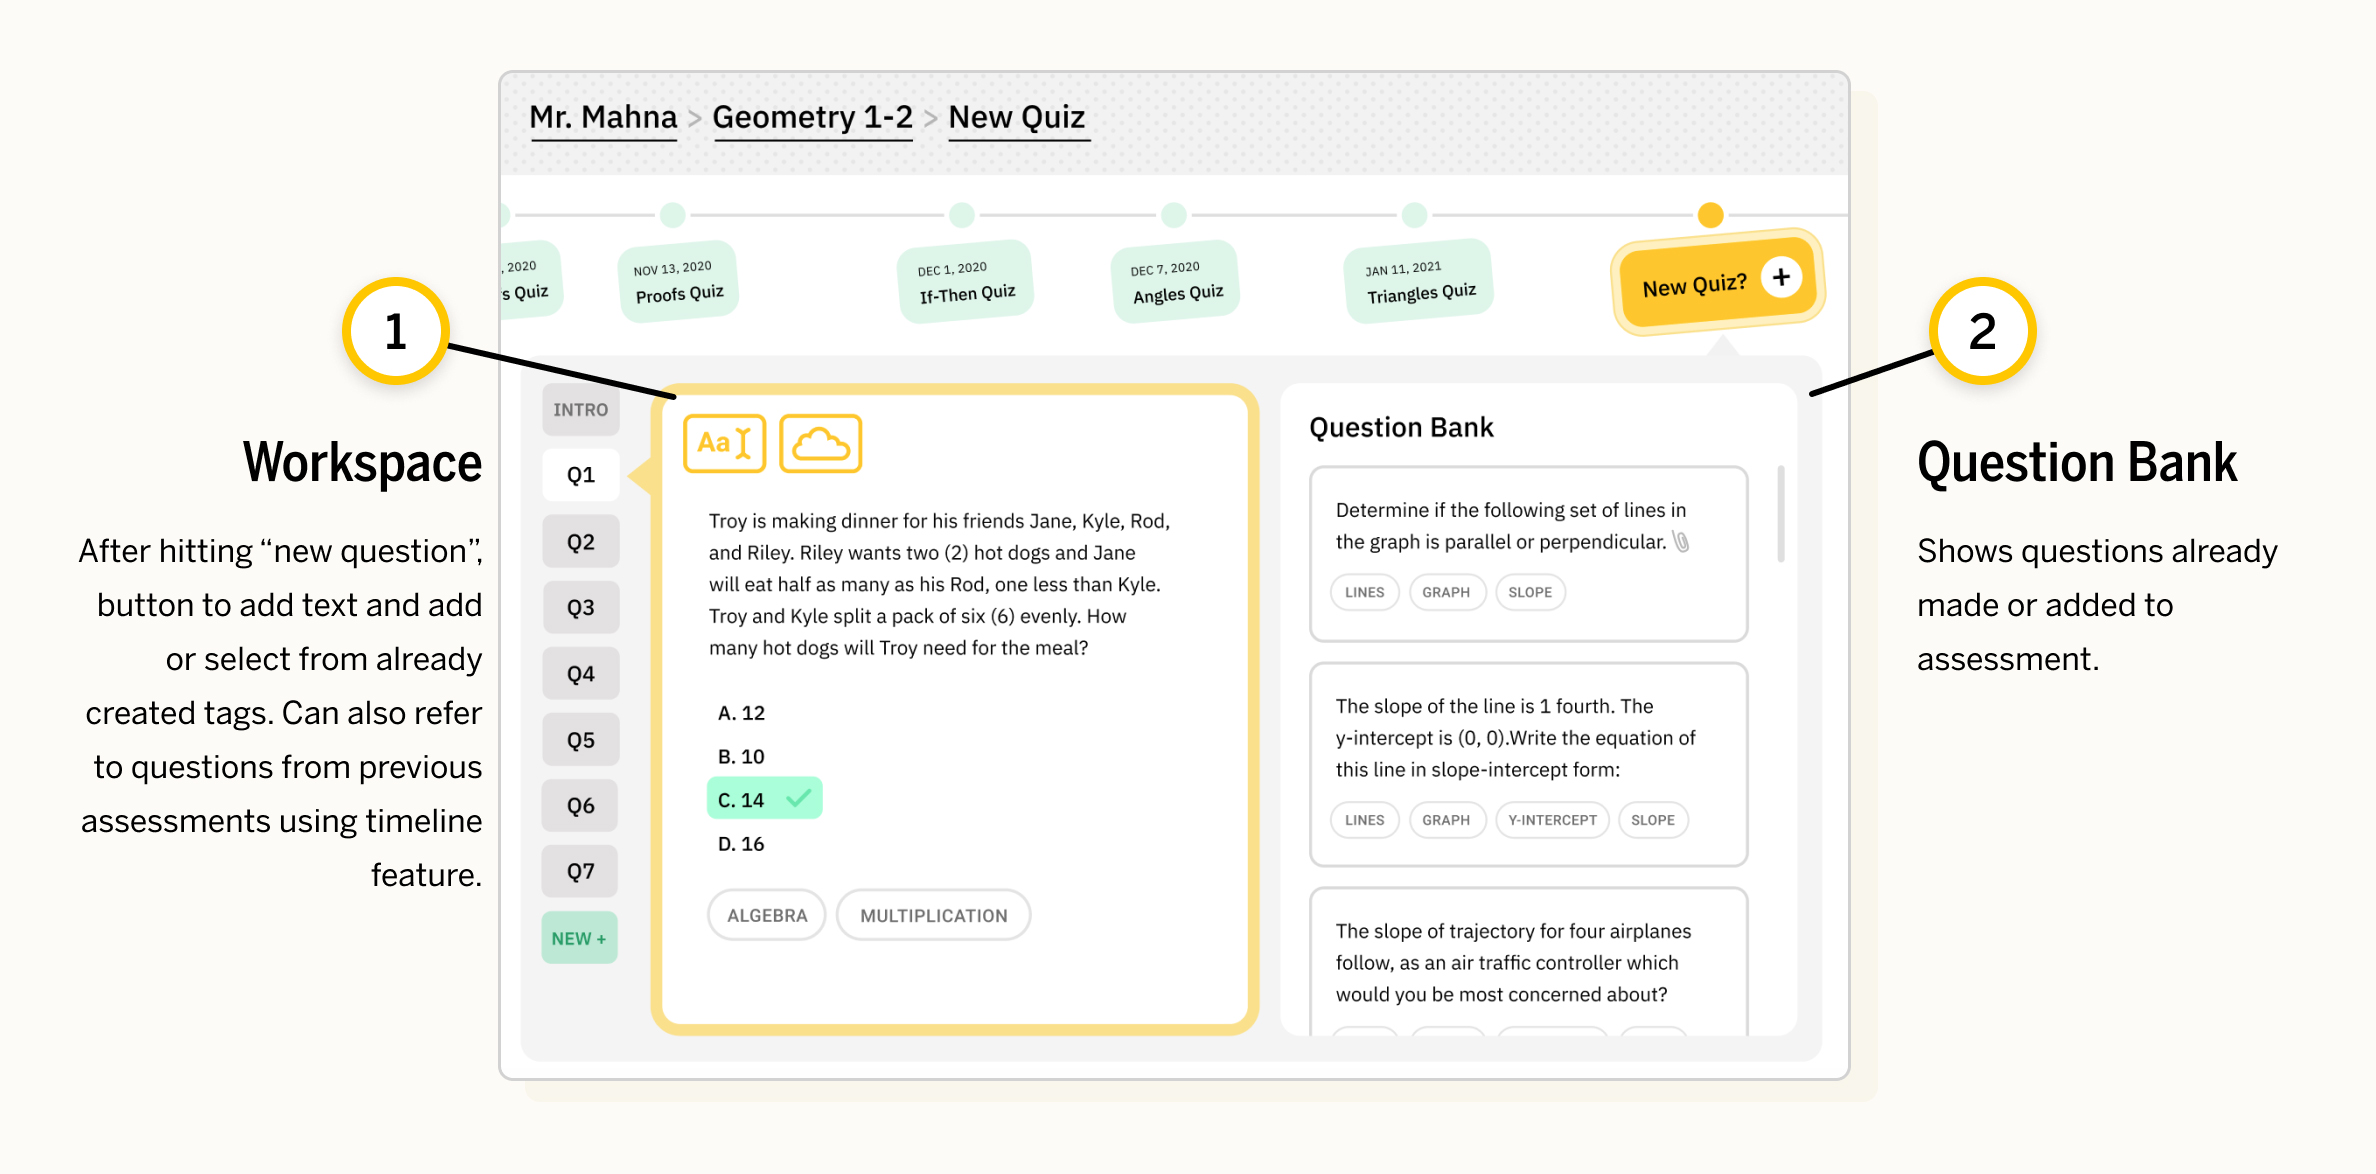 The Quiz Builder is designed for creating questions in an assessment and tagging them with relevant subject markers and knowledge categories. Questions can also be stored and rearranged in a Question Bank.
Designed as a simple WYSIWYG editor, the Quiz Builder is created for the first use case of teachers developing quizzes for their students. In the ideal use case, the Quiz Builder can be used by any learner to create their own knowledge review test. At the top of this interface is a timeline displaying the past history of quizzes, to contextualize the new quiz in the learning journey so far.
Interface 2: Reflections
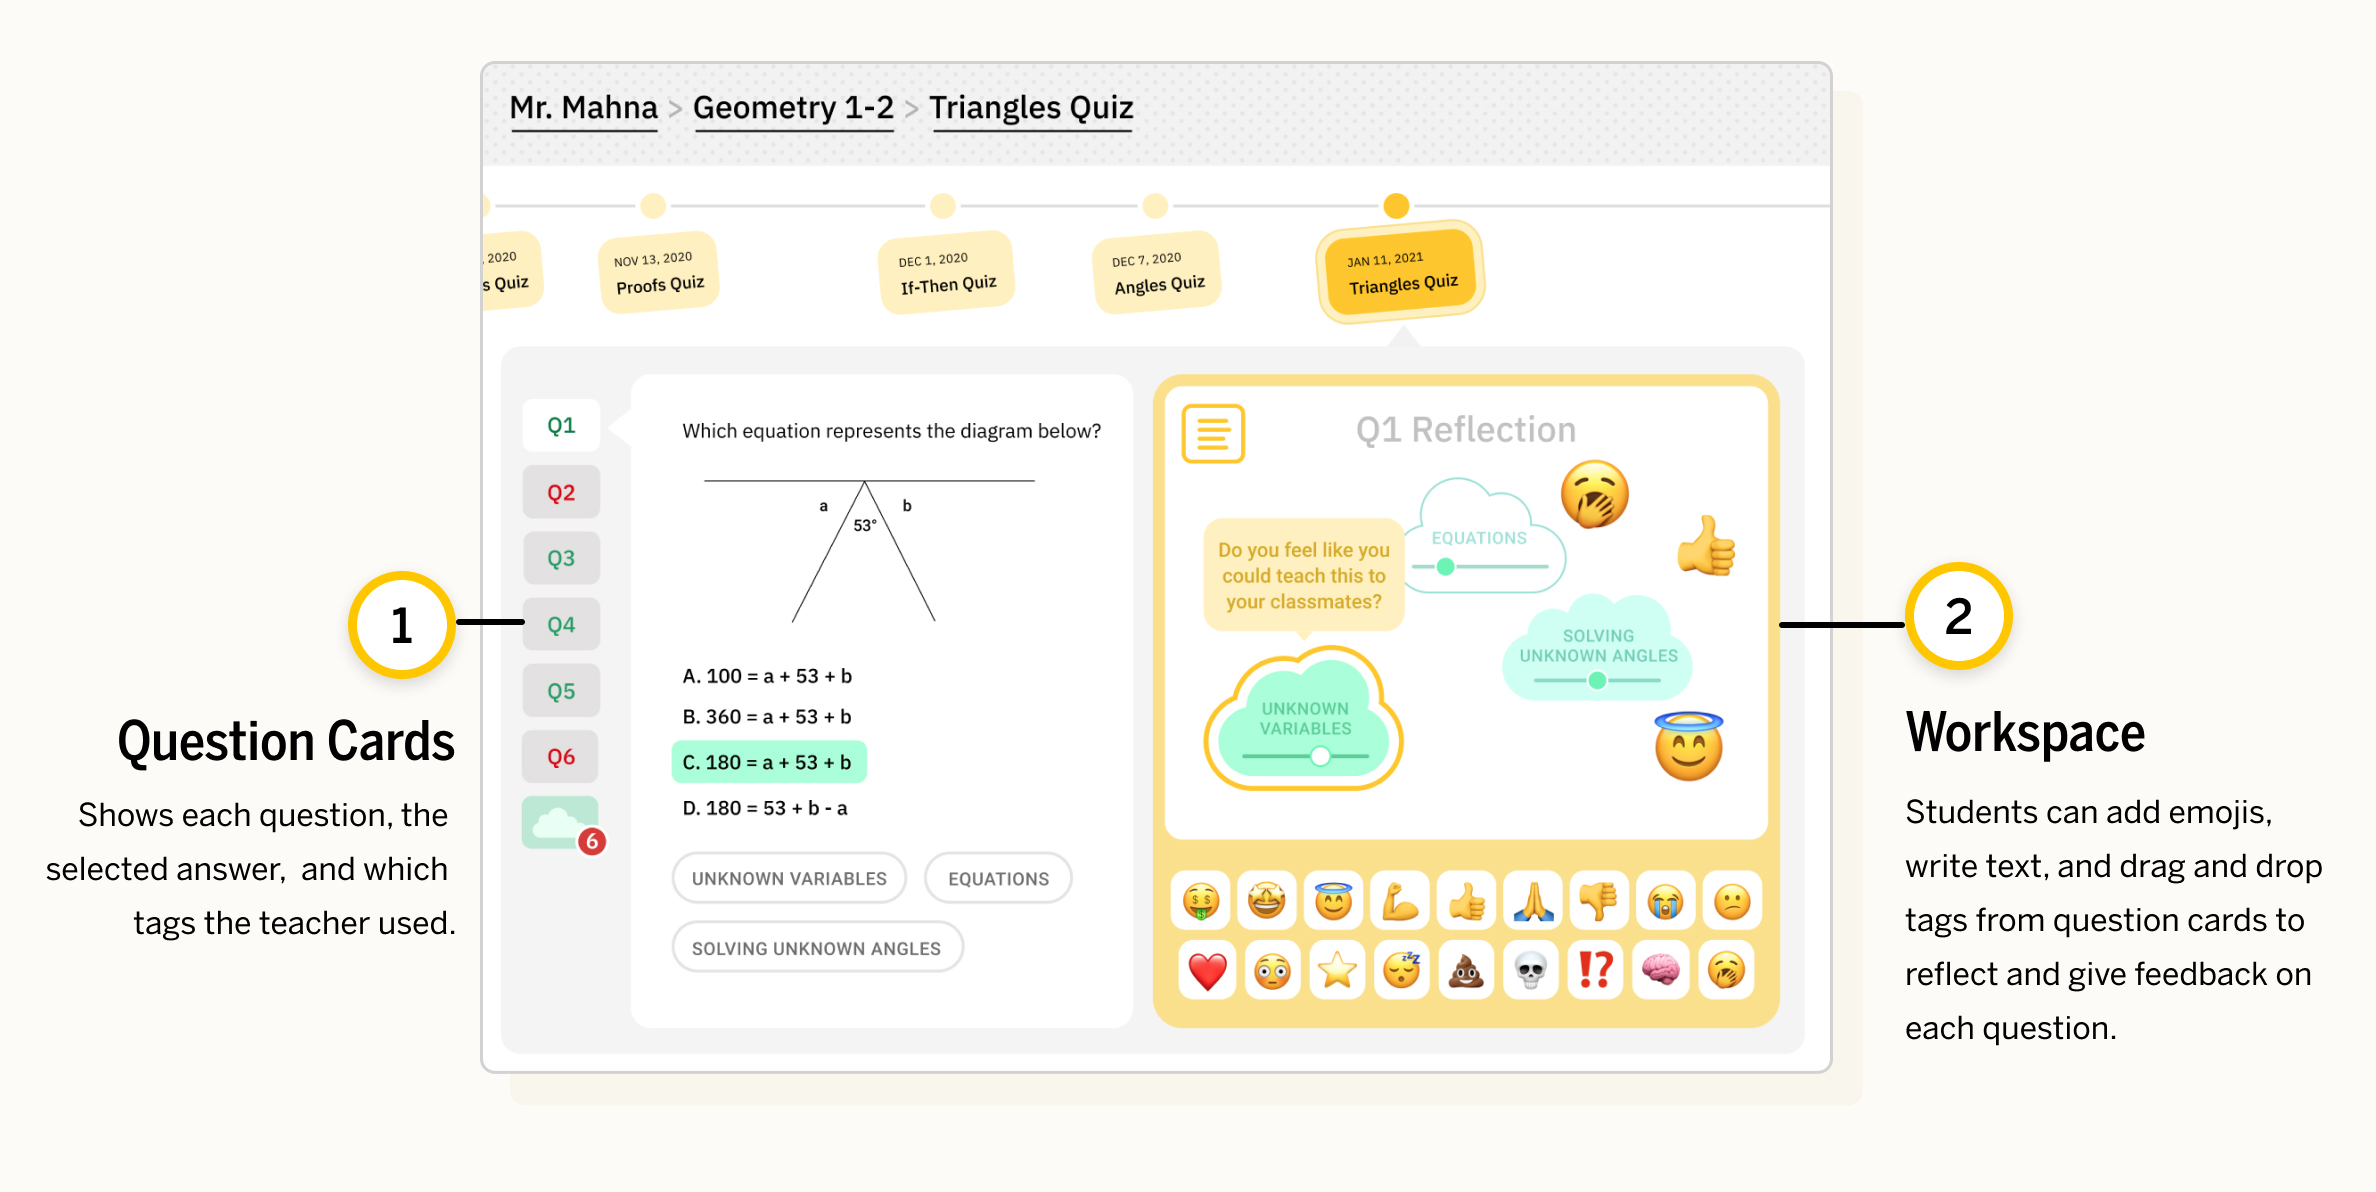 The Reflections interface allows a learner to self-reflect on the outcome of their quizzes, providing detailed feedback into the dashboard for their growth journey.
The Reflections interface is a core part of the feedback loop for a learner. After completing a quiz, a learner can see their assessment outcome and reflect on their own feelings, questions, and confidence levels related to a topic. In the first use case, students will reflect on their responses to the quiz questions designed by their teachers; in the ideal use case, learners will have designed or chosen their own assessment metrics, so they can use this space to not only review their performance but the quality of their own quiz design.
Furthermore, this interface introduces the use of Emojis to symbolize feelings. Used as a shorthand for describing the emotional weight of an assessment and its outcome, this feature can help learners attend to their own personal responses to subjects and come to alignment with their interests and strengths.
Interface 3: Growth Takeaways
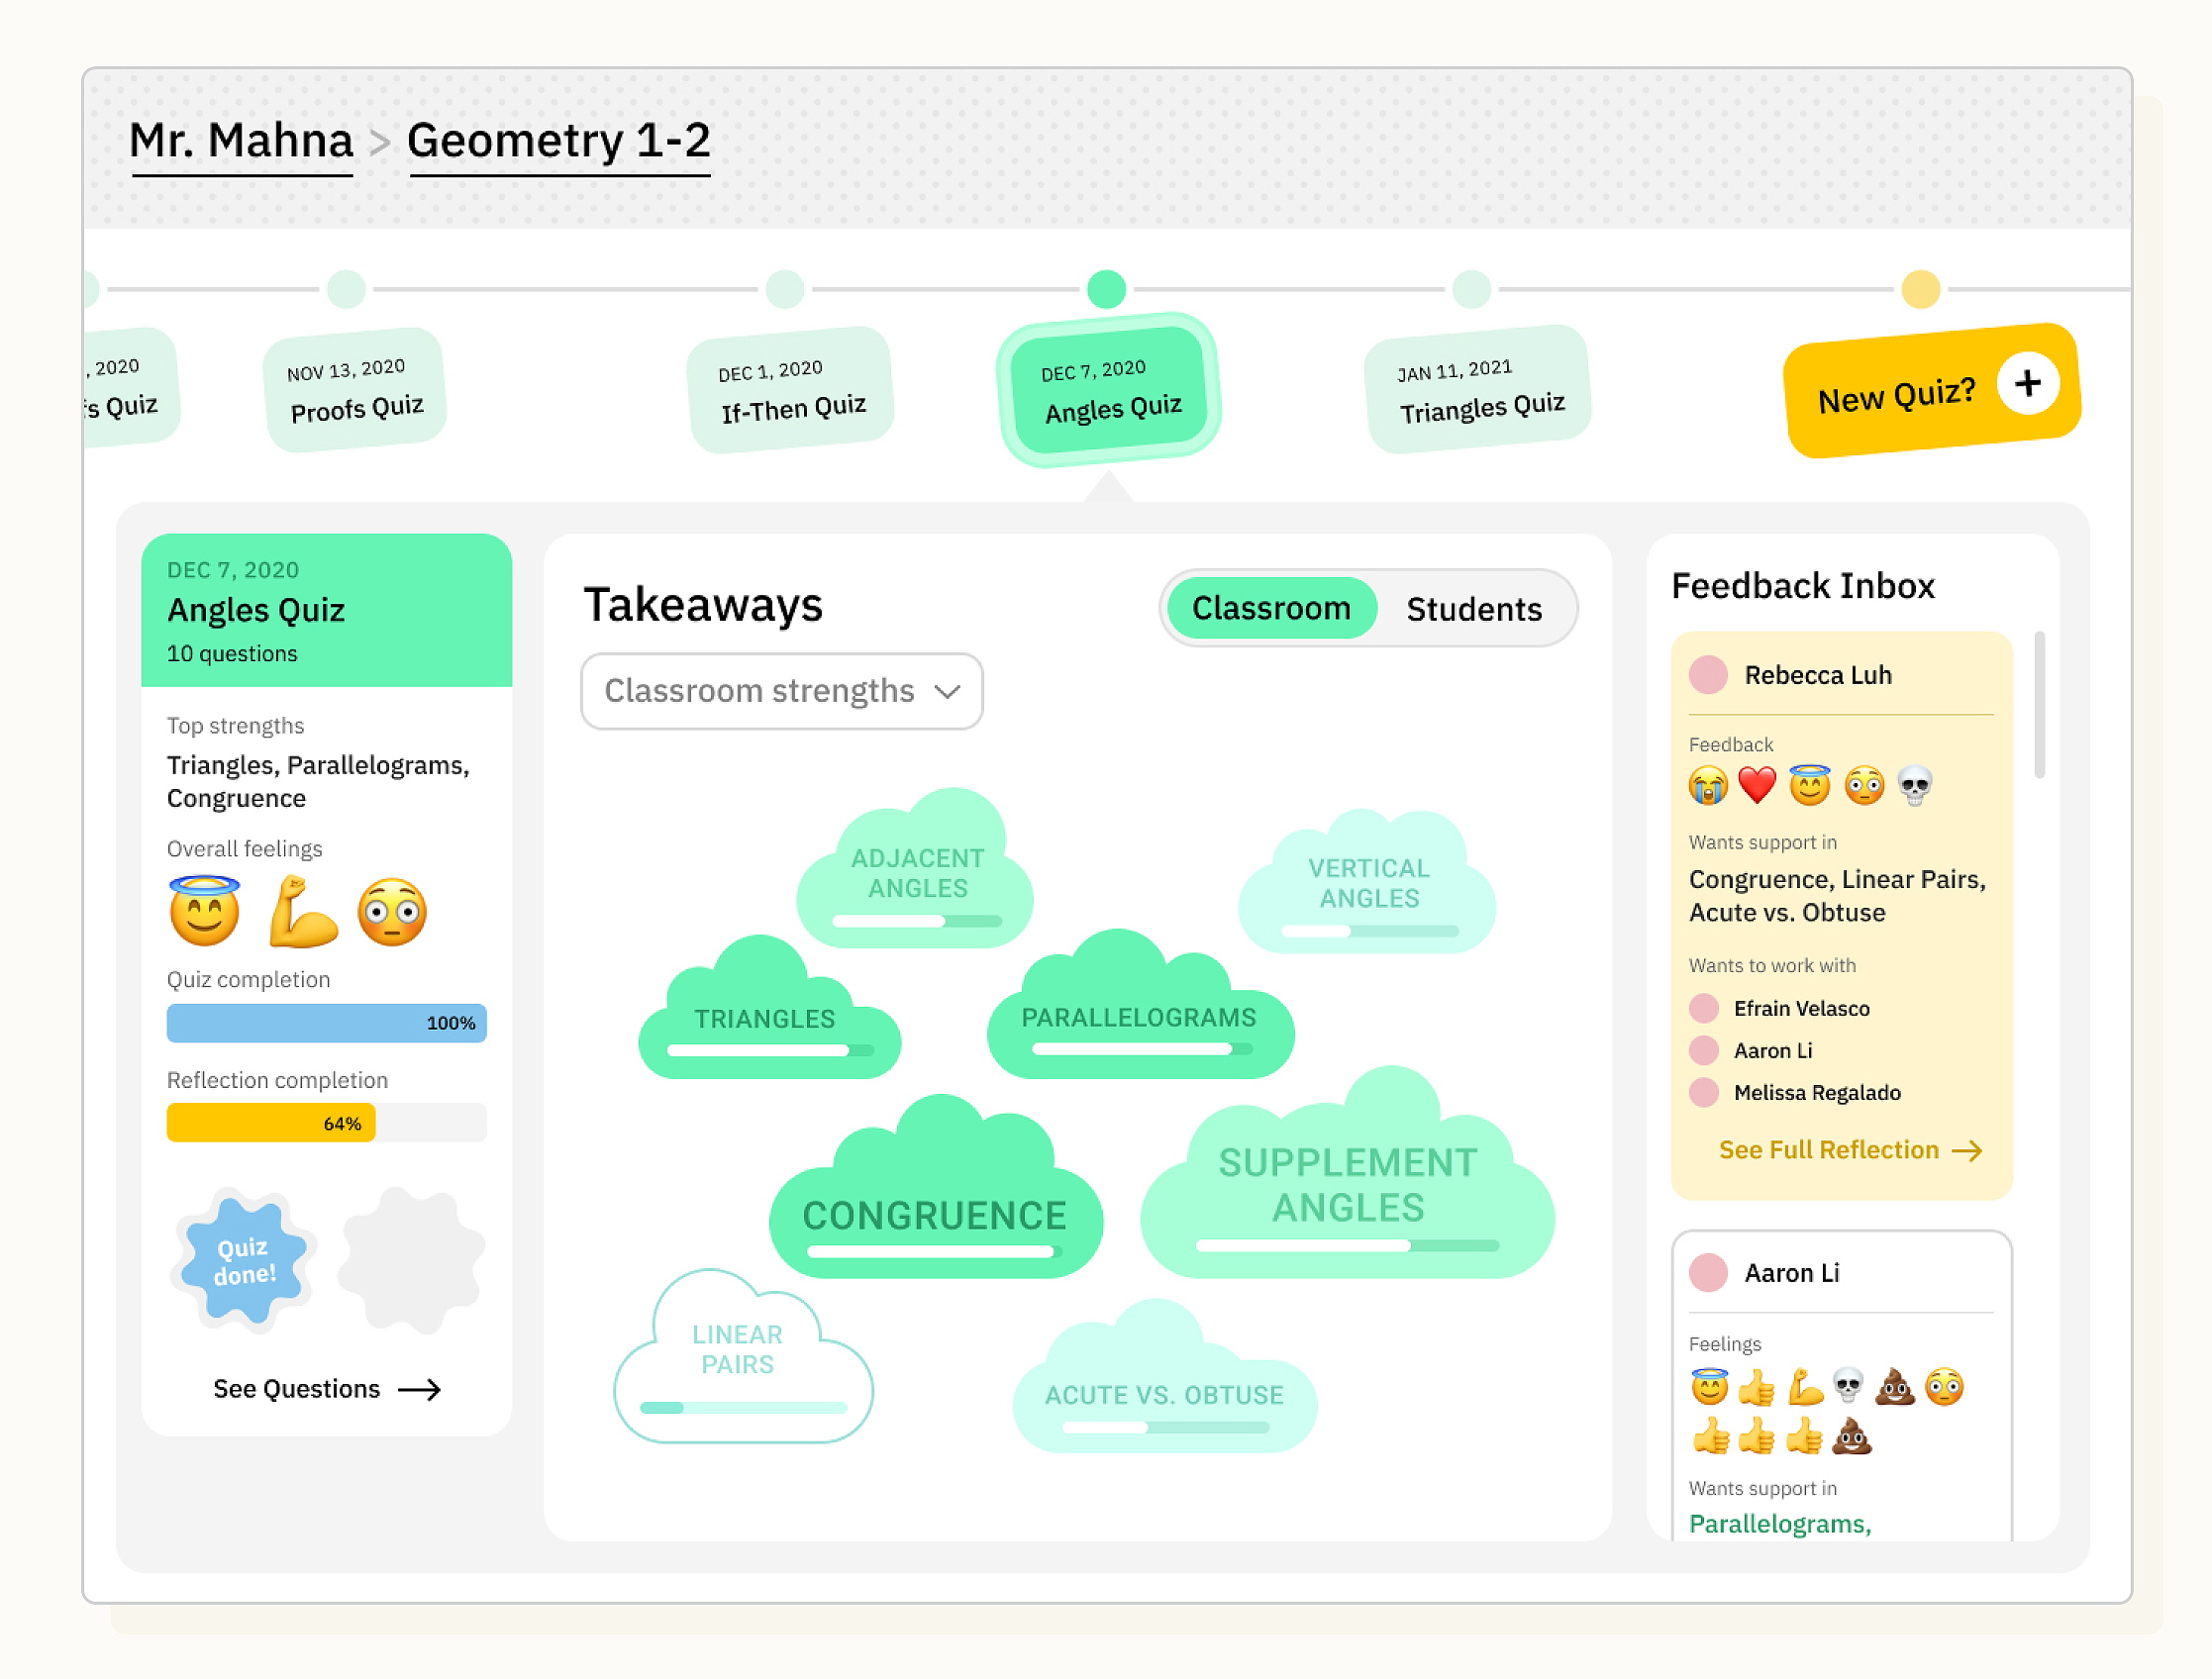
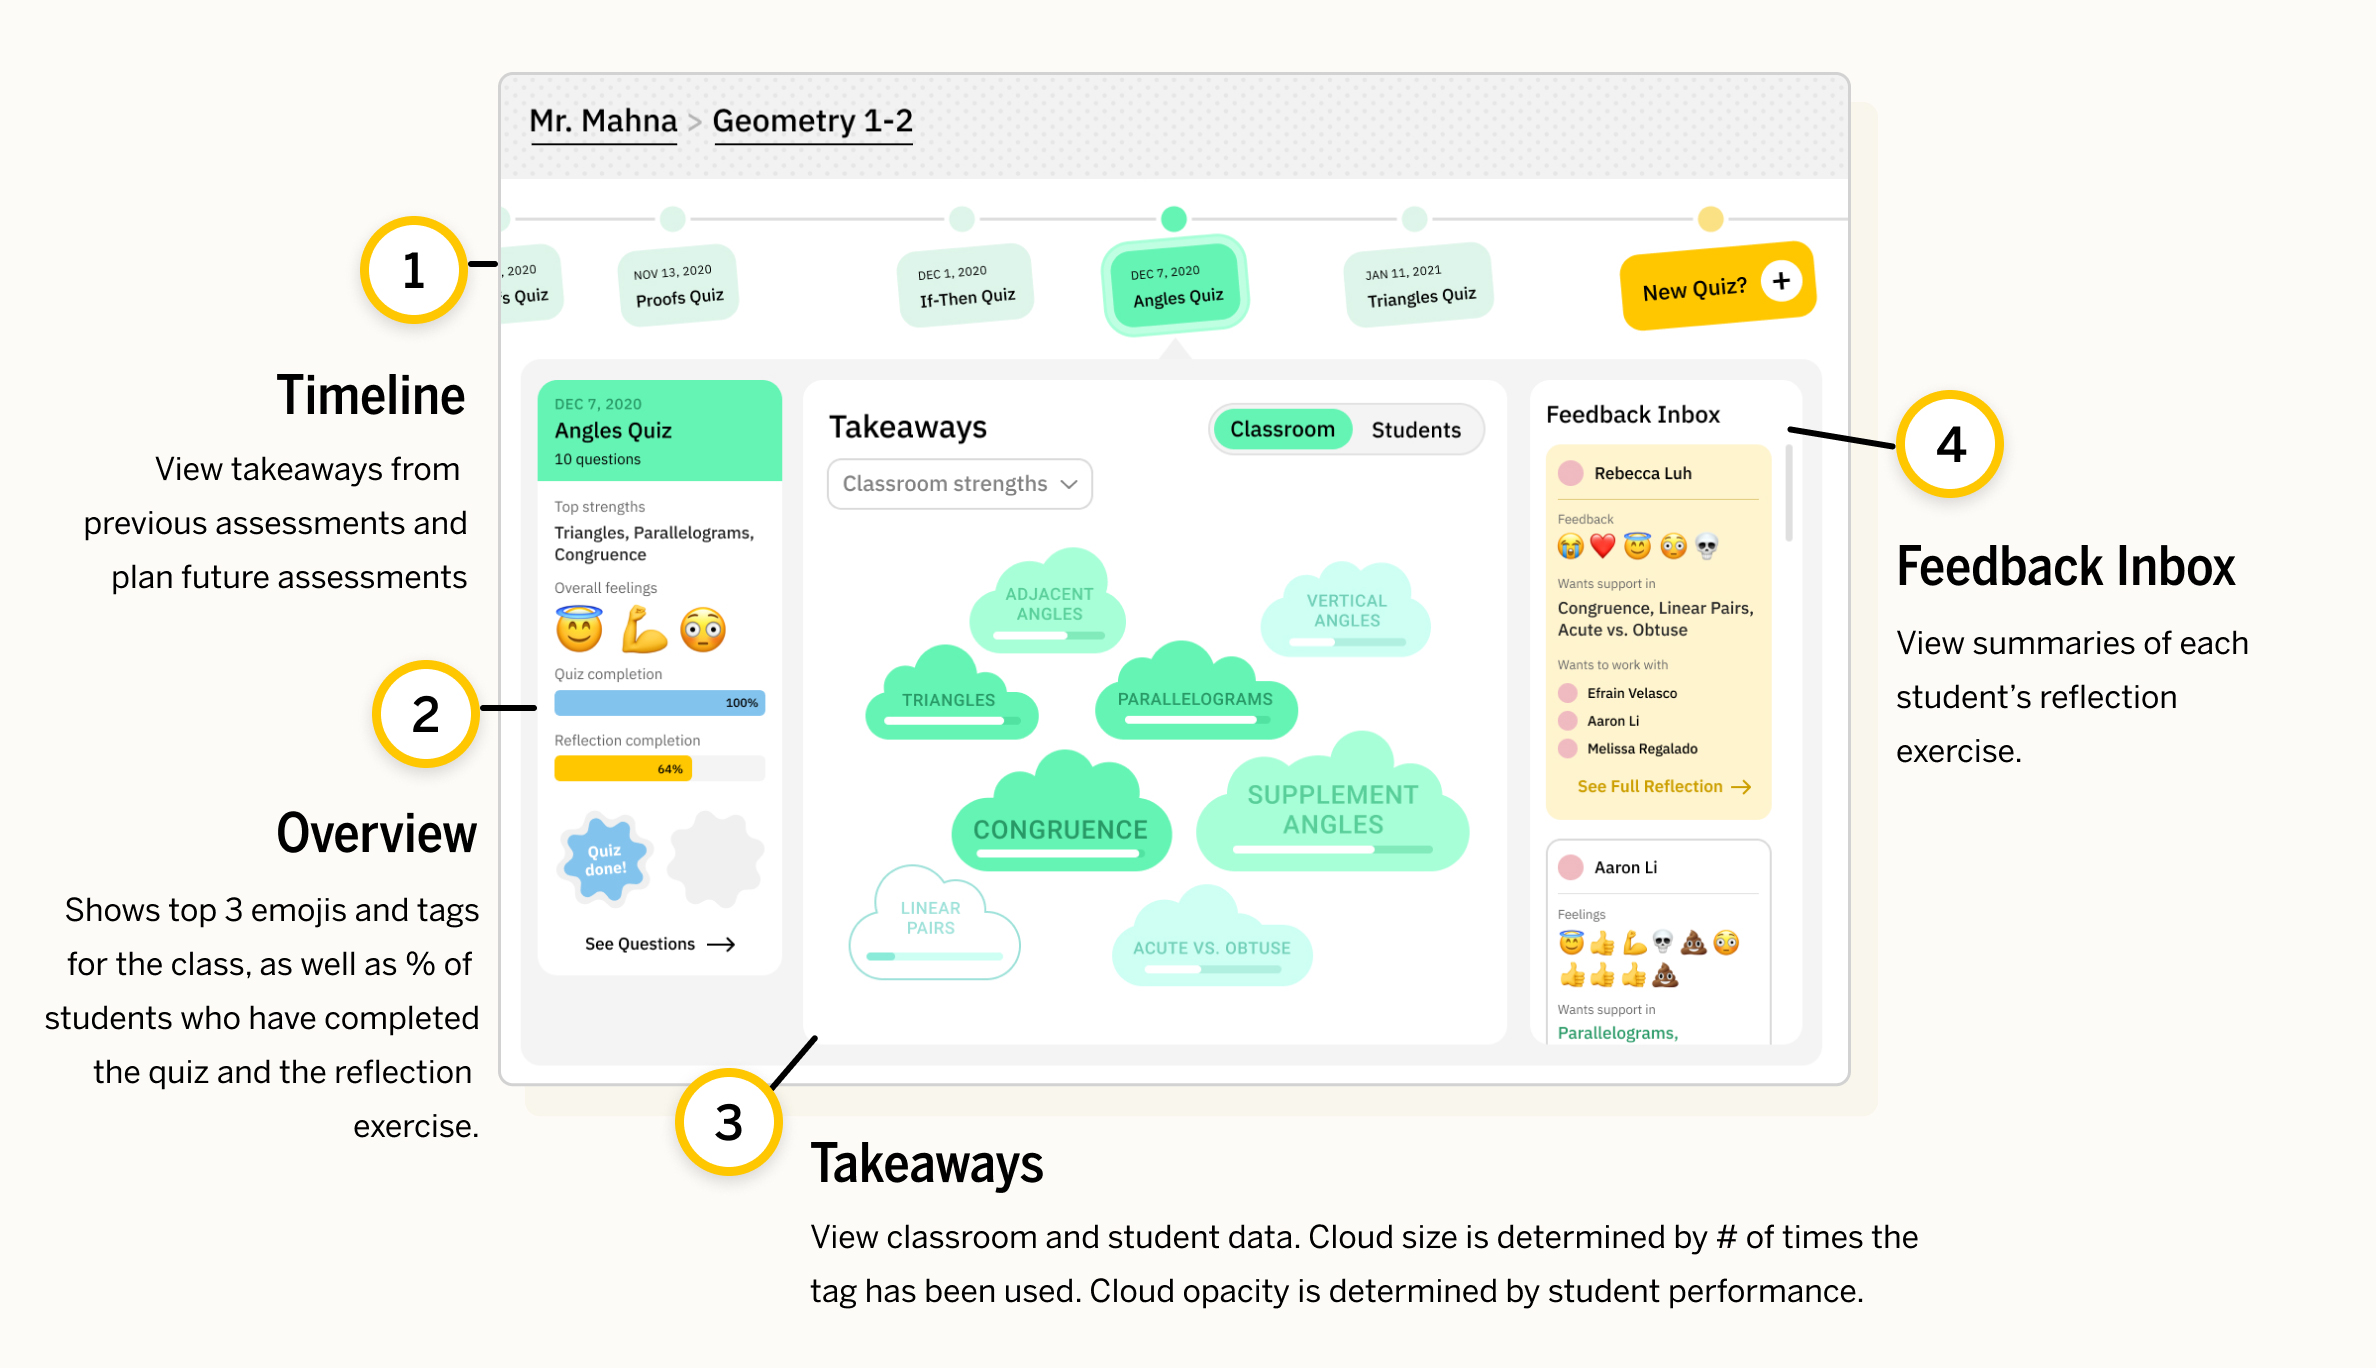 The Growth Takeaways displays key tags and the overall performance on them for a quiz, as well as aggregate reflection feedback.
In the first use case, the Growth Takeaways interface is the teacher's visualization of student performance on a quiz, which can be viewed for each individual student or for the overall classroom. It also shows student feedback, including emotional interest and areas they want additional support in. In the ideal use case, these takeaways are for learners to see at a glance what their strengths and emotional responses are, based on the metrics they set to evaluate themselves for. In both use cases, the Growth Takeaways complete the feedback cycle of the dashboard by informing the design of future quizzes.
Up next: consensual education!
Even though this dashboard focused on a first use case that was distinct from our desired vision for education, this collaboration helped Plot Twisters formally recognize what we sought to design for our proprietary tools more clearly. We illuminated key behaviors for self-reflection tools: the ability to create one's own evaluatory "quizzes" or metrics; the ability to visually parse progress based on those metrics; and the ability to gather overall themes so we are more equipped to update our metrics for progress. These takeaways reflect our interests in empowering learners to discover their intrinsic motivation for learning a topic; they allow learners to transparently understand their own progress and make decisions to move closer to their targets or change them.
Furthermore, elaborating on the current behavioral breakdown between teachers and students allowed us to witness the power dynamics at play in a traditional teacher-centered classroom. By balancing both this use case and our ideal learner-centered use case, we have arrived at tangible design decisions to enable consensual and self-motivated educational structures moving forward. We are excited to integrate these interface affordances and what we learned from our design research into the creation of the Plot Twisters game world.